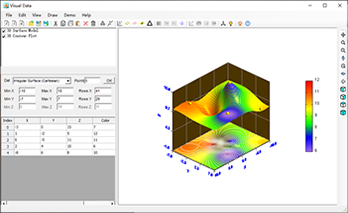
The following diagram shows the main interface of Visual Data. You can create and modify data graphs by using menus and toolbars in the main interface. The label of each graph is shown in Graph Manager. By checking or unchecking the checkbox before the graph label, you can show or hide the corresponding graph in Plot Area.
Download Visual Data today and start creating stunning scientific visualizations for your research and analysis.
